Why Do I Need a Dashboard?

I Haven’t Had One Before, Why Now?
This is a question that often comes up when I talk with new customers about business analytics and dashboards. A lot of these organizations have been in business for decades and have never used a dashboard before. They have built and run their organizations using spreadsheets, databases, and in many cases their gut instincts so when I tell them that a dashboard is a vital part of any organization’s tool kit it is met with skepticism. How can something they have never used before now be so important to their business? My answer focuses on three important things a dashboard does; measure performance, change culture, and show what’s happened in the past and what might happen next.
Dashboards provide a low cost way to measure and monitor key performance indicators (KPIs) that have a major impact on how a business is performing. Examples of KPIs would include things like staff productivity, accounts payable and receivable, services delivered, and the demographics of the population served. Not measuring your KPIs means that you are missing valuable information about how your business is performing. Every organization I have met with has had more processes and workflows than any one person could efficiently keep track of which is a foundation for problems in the future. Dashboards can bring all of these separate data elements together and create a central source of information that covers every part of the organization.
A dashboard can also be an excellent tool for promoting a change in the work culture. When staff can view and interact with dashboards that directly relate to the work they are doing they get a much better understanding of the role they play in a business’ operations. Seeing how they contribute helps to establish a business culture that supports change when staff can see how that change is tied to improvement and achieving the organization’s mission.
Staff can also use dashboards to help predict what might happen in the future. Trend tracking and predictive analytics are some of the insights that dashboards provide. Using what has happened in the past as a baseline, a dashboard can then model what will happen in the future. When a dashboard is used as part of a predictive analytics toolset it can prepare your business for what’s coming next and give you the advantage you need to seize opportunities and avoid problems.
A Quick Story
Another concern that people express when discussing dashboards in that they seem too complicated and would leave staff feeling overwhelmed. I can understand that because I have seen a lot of badly designed dashboards that did exactly that, cause confusion and frustration. But when I think about dashboards, I liken it to a very simple concept from when I was growing up, my mom’s weekly dinner schedule. Now even though my mom made great food there were some things that I just did not want to eat. So her weekly planner was a great way to see what was coming that week and helped me plan when to eat at a friend’s house (cauliflower casserole, no thanks!) and when I definitely wanted to be at home (roast chicken with chocolate cake for dessert). My mom’s planner was my first introduction to a useful dashboard; simple, informative, and helping me realize opportunities and avoid problems. That is the key foundation for making a dashboard useful to people. They need to understand it at a glance and feel that it is actually useful to them when they use it.
Back to the Point
I could have trusted my gut as to what my mom would be cooking from day to day…but why? There was a simple dashboard available that could tell me exactly what I needed to know. That same concept can be applied to executives that are trying to ensure their organizations are running effectively and efficiently, while also preparing for what may happen in the future. Why rely on instinct alone or dig through numerous spreadsheets and reports looking for answers when everything can be presented on a clear, concise dashboard. When talking to executives I have been able to see some common trends that reinforce this. Their organizations have plenty of data but it can be hard to extract, organize, and analyze to make it useful. Often they say their organization needs more analysts to overcome these data hurdles but it’s just not in the budget. Just take a moment and think about how many data sources an organization has and it is easy to see why they feel this way.
Example of Data Sources
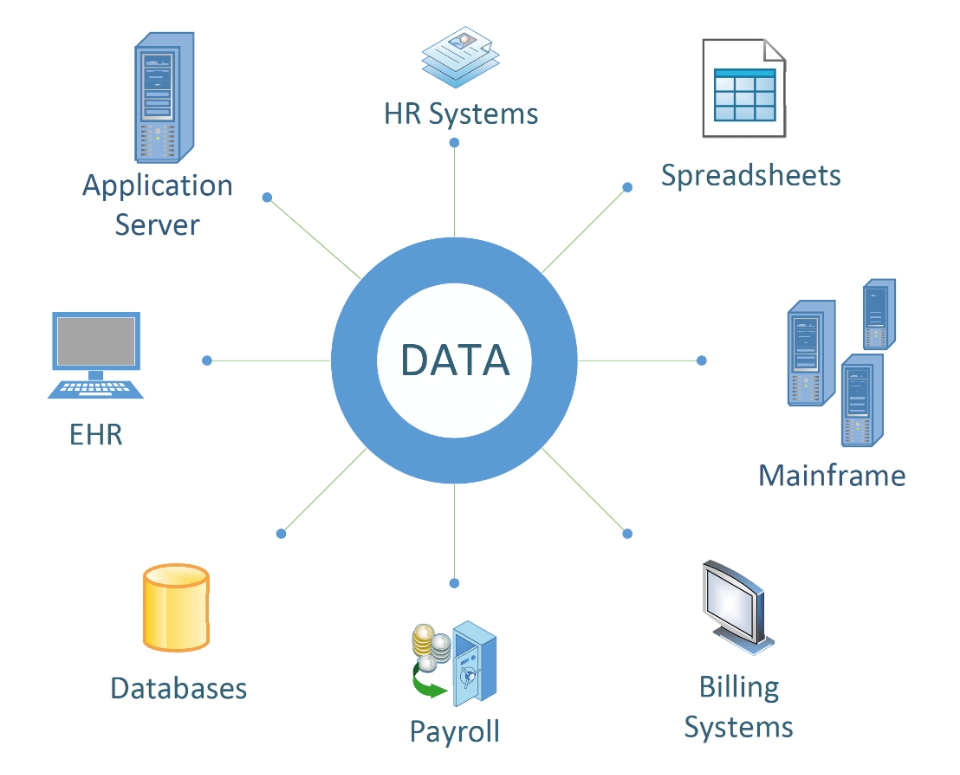
For organizations that attempt data analysis many feel they are fighting an uphill battle with limited resources. A lot of time is spent trying to mine data from various sources across the organization and then trying to condense it into relevant reports. But time itself is a critical resource, not just for the analysts that are producing the reports but for managers that need to read, understand, and act on those reports. In my time working with executives I have never met one that said they had enough time to sit and thoroughly read all the reports they are given. Their schedules are packed, and they need facts and answers quickly. Traditional reporting methods just aren’t built to do that, and since these reports are often tied to just one or two data sources they often give an incomplete picture. Why? Because it can be incredibly hard to blend data together from different sources, especially if you are using traditional tools like spreadsheets.
All of this leads to the fact that the more hurdles an organization has mining, analyzing, and understanding the data coming from their systems the more likely they are to rely on gut instinct instead. That’s problematic in the current business environment where using data to guide decision making is the gold standard for business operations. Over time not using data leads to blind spots developing for the organization either because an executive’s instinct is no longer in sync with the business environment or the day to day operations have become too complex and sprawling to review daily. This is when dashboards come into the picture.
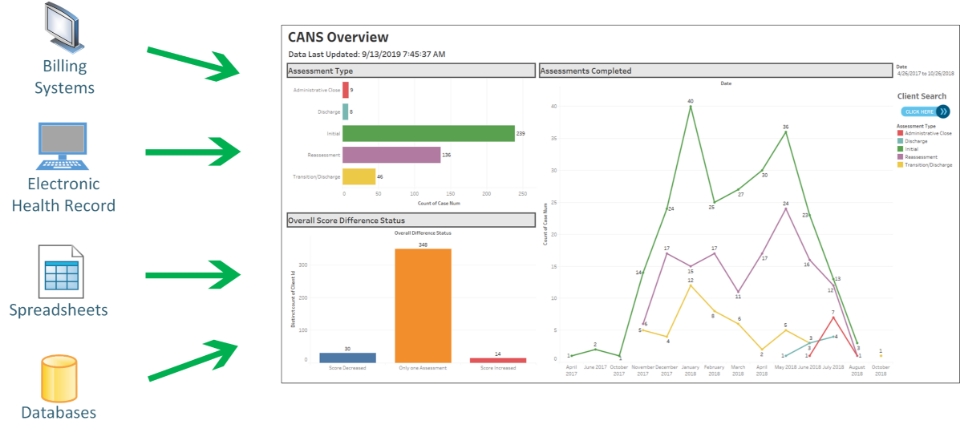
Dashboards eliminate the need to sort through spreadsheets, databases, or reports to find what you’re looking for. They can be built to mine data from several sources at once and blend them together seamlessly in the background. With just a quick look at a dashboard all the organization’s KPIs can be reviewed. Not only does this save a huge amount of time but it also gives you the facts you need to base your decisions on. Combined with a leader’s business instincts a dashboard is a powerful tool as business environments grow more complex and decisions become more time sensitive. Dashboard development also breaks down existing data silos by tapping into and merging any number of data sources resulting in higher quality data and better analysis.
Multiple Data Sources into a Single Dashboard
The Wrap Up
Dashboards have a great ability to bring together a lot of data and present it in a way that makes it quick and easy to understand. This helps fuel data driven decisions based on KPIs to show what is happening throughout the organization. At the same time dashboards promote a work culture centered around data, and objectives that staff find meaningful to them. Since dashboards are built using data sources that are already in place they can be implemented without having to change an organization’s current systems. This allows people to use a dashboard that has data they are already familiar with, which helps to speed up integrating dashboards into your day to day processes to drive things forward. Did all this make you more interested in making dashboards a part of your business strategy? Feel free to contact us with any questions you may have!